Monitoring server performance including monitoring the security server of Structured Query Language (SQL) is one of the primary jobs of Server Administrator. The purpose of this tool is to monitor the server so that you know how the state of the server, database, and SQL. You may store a lot of important files on your database server so you have to monitor the status of your SQL server and database just in case there is something strange or mistakes that can damage your network system. Therefore, you must choose the best SQL server monitoring tools so that you can monitor your database server and can overcome quickly if there is a problem. Here are 10 best SQL server monitoring tools that you can consider to install.
Best SQL Server Monitoring Tools List
Let’s firstly the first start with Microsoft built in SQL server monitoring tools. Microsoft SQL Server provides a comprehensive set of tools for monitoring events in SQL Server and for tuning the physical database design. The choice of tool depends on the type of monitoring or tuning to be done and the particular events to be monitored. The following are the SQL Server monitoring and tuning tools.
| Tool | Description |
|---|---|
| sp_trace_setfilter (Transact-SQL) | SQL Server Profiler tracks engine process events, such as the start of a batch or a transaction, enabling you to monitor server and database activity (for example, deadlocks, fatal errors, or login activity). You can capture SQL Server Profiler data to a SQL Server table or a file for later analysis, and you can also replay the events captured on SQL Server step by step, to see exactly what happened. |
| SQL Server Distributed Replay | Microsoft SQL Server Distributed Replay can use multiple computers to replay trace data, simulating a mission-critical workload. |
| Monitor Resource Usage (System Monitor) | System Monitor primarily tracks resource usage, such as the number of buffer manager page requests in use, enabling you to monitor server performance and activity using predefined objects and counters or user-defined counters to monitor events. System Monitor (Performance Monitor in Microsoft Windows NT 4.0) collects counts and rates rather than data about the events (for example, memory usage, the number of active transactions, number of blocked locks, or CPU activity). You can set thresholds on specific counters to generate alerts that notify operators. |
| Open Activity Monitor (SQL Server Management Studio) | The Activity Monitor in SQL Server Management Studio is useful for ad hoc views of current activity and graphically displays information about: |
| Live Query Statistics | Displays real-time statistics about query execution steps. Because this data is available while the query is executing, these execution statistics are extremely useful for debugging query performance issues. |
| SQL Trace | Transact-SQL stored procedures that create, filter, and define tracing: |
| Error Logs | The Windows application event log provides an overall picture of events occurring on the Windows Server and Windows operating systems as a whole, as well as events in SQL Server, SQL Server Agent, and full-text search. It contains information about events in SQL Server that is not available elsewhere. You can use the information in the error log to troubleshoot SQL Server-related problems. |
| System Stored Procedures (Transact-SQL) | The following SQL Server system stored procedures provide a powerful alternative for many monitoring tasks: |
| DBCC (Transact-SQL) | DBCC (Database Console Command) statements enable you to check performance statistics and the logical and physical consistency of a database. |
| Built-in Functions (Transact-SQL) | Built-in functions display snapshot statistics about SQL Server activity since the server was started; these statistics are stored in predefined SQL Server counters. For example, @@CPU_BUSY contains the amount of time the CPU has been executing SQL Server code; @@CONNECTIONS contains the number of SQL Server connections or attempted connections, and @@PACKET_ERRORS contains the number of network packets occurring on SQL Server connections. |
| Trace Flags (Transact-SQL) | Trace flags display information about a specific activity within the server and are used to diagnose problems or performance issues (for example, deadlock chains). |
| Database Engine Tuning Advisor | Database Engine Tuning Advisor analyzes the performance effects of Transact-SQL statements executed against databases you want to tune. Database Engine Tuning Advisor provides recommendations to add, remove, or |
These are the Microsoft built-in SQL server performance monitoring tools. Read more on performance monitoring and tuning tools. But the below list is third party SQL Server performance monitoring tools.
2. SpiceWorks: SQL Server Monitoring Software
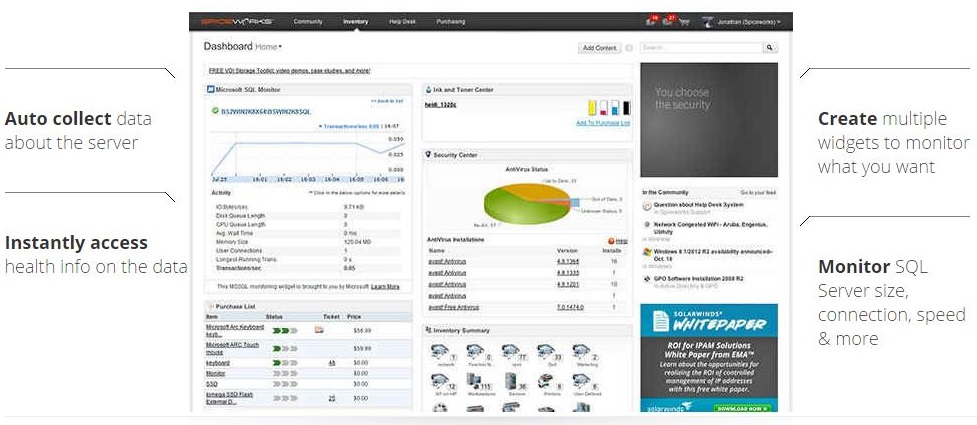
Looking for a simplified means of keeping an eye on your SQL Servers? Spiceworks lets you stay on top of performance so that you’ll detect issues before your users do… all for free!
Get fully automated SQL database monitoring. Spiceworks automatically retrieves information about SQL databases on your network (SQL Server 2005 and higher). Health checks are run every minute to ensure info is always accurate and up-to-date. With Spiceworks SQL Server Monitoring, you can monitor SQL Server size, connection, speed & more.
3. Idera: Free SQL Server Tools for Every DBA
Idera provides many free best SQL Server monitoring tools such as monitoring and performance tool, backup & administration, security & compliance, development and database management tools.
Monitoring & Performance:
Comprehensive SQL monitoring, management, and performance tools to help you find & fix issues fast.
- SQL Check: Free real-time performance monitoring for SQL.
- SQL Fragmentation Analyzer: Detect fragmentation hotspots across SQL Servers.
- SQL XEvent Profiler: SQL XEvent efficiency with SQL Profiler simplicity.
- SQL Heat Map: View SQL Server storage utilization.
- SQL Page Viewer: Easily access SQL Server page data.
- SQL Update Statistics: Update out-of-date SQL Server statistics.
- SQL Statistics Aggregator: Simplify SQL query tuning.
- SQL Hekaton Memory Check: Monitor SQL Memory-optimized tables.
- SQL Instance Check: Discover SQL Servers and Check for Version Updates.
- SQL BI Check: Monitor the performance of your SQL BI stack.
- SQL Query Store Optimizer: Improve SQL Server Query Store performance.
- MySQL Query Explorer: Monitor and Tune MySQL Queries.
Backup & Administration
Easily backup SQL Servers and streamline day-to-day tasks with these must-have products.
- SQL Backup Status Reporter: View SQL Server backup history.
- SQL Integrity Check: Identify SQL Server corruption areas.
- SQL Job Manager: View and manage SQL Server jobs across multiple servers.
- PowerShell Plus: Learn and master PowerShell fast.
- PowerShell Scripts for SQL: 89 free scripts to simplify SQL Server administration.
Security & Compliance
Improve SQL Server audits, strengthen permissions security & alert on data changes in your environment.
- SQL Permissions Extractor: Easily extract and migrate SQL user permissions.
- SQL Column Search: Identify Potentially Sensitive Data in SQL Server Tables.
Development
Quickly manage database development with these easy-to-use tools.
- Rapid Database Extractor: Simplify Oracle and SQL Server database exploration.
Even more, tools to find and fix SQL Server performance problems, diagnostic and troubleshooting in minutes.
4. SolarWinds: SQL Server Monitoring Tools
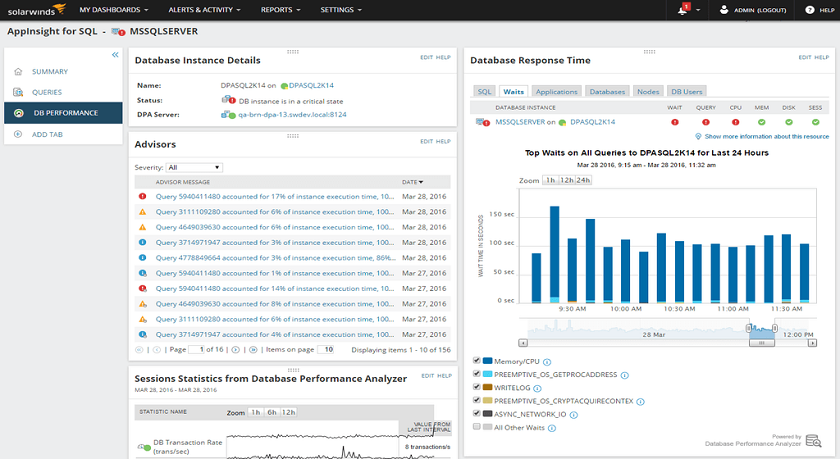
Try to perform SQL Server monitoring task with database performance analyzer for SQL Server by SolarWinds and get a comprehensive view of database performance management.
- Correlate server health metrics with query response time: Monitor capacity constraints, queries, waits and server health performance.
- Identify blocked SQL queries: Drill down to blocked SQL Server queries to discover why the database server blocked them.
- Find inefficient code: Analyze factors that impact SQL Server execution and see how the code works in production.
- Learn how resources impact SQL Server: Understand how server resources impact query response time and overall database performance.
Read more about SolarWinds SQL server performance monitoring tools on SQL Server Monitor.
5. ManageEngine: Free SQL Performance Monitoring Tool
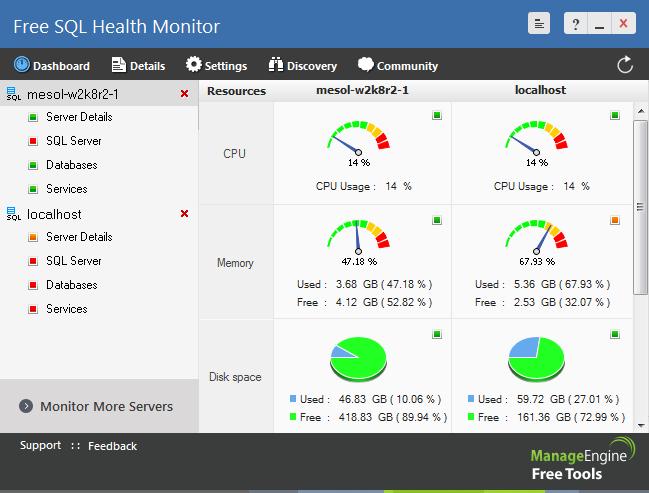
Keep an eye on your SQL Server performance! Database servers are critical to business and need to be highly available. ManageEngine SQL Health Monitoring Tool helps monitor MS SQL Servers for performance, availability, and monitors all the MS SQL versions including MS SQL 2012 and 2016. You can monitor up to two SQL Servers simultaneously. The tool supports both default and named instances.
Free SQL Health Monitor Features:
- Monitor the performance of all MS SQL Server versions up to MS SQL Server 2014
- Keep a tab on the performance parameters of both default and named instances
- Get a dashboard view of system resources used & MS SQL performance parameters
- Fetch the status of Windows services related to your MS SQL Server
- Keep an eye on buffer, memory, lock and latch details of your MS SQL Server
- Generate real-time performance reports in PDF format and Email it from the tool
Find more related to ManageEngine SQL performance monitoring tool on ManageEngine SQL Tool.
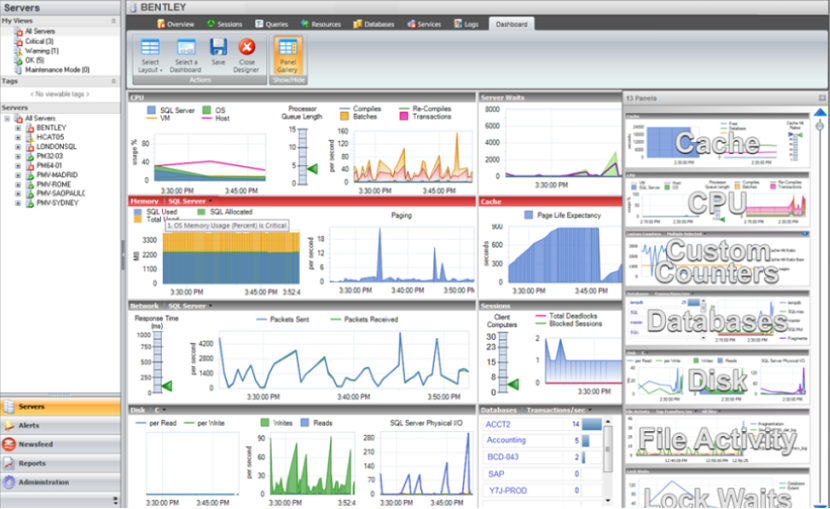
6. Dell: Database management solutions
It has powerful capabilities that help you monitor and discover database performance. Find out how this database management software tools can automate routine tasks, provide high-quality data, standardize database performance monitoring, drive greater data availability and become more agile with our proven solutions.
Supported Platforms
With industry-leading support for Oracle, SQL Server, DB2, SAP, MySQL, Postgres, and dozens of other relational and non-relational platforms such as Hadoop, MongoDB, and Cloudera, Dell database management software solutions provide comprehensive support for almost any environment. Click below for more in-depth information on a few of the platforms we support. Dell Database Management.
7. ApexSQL
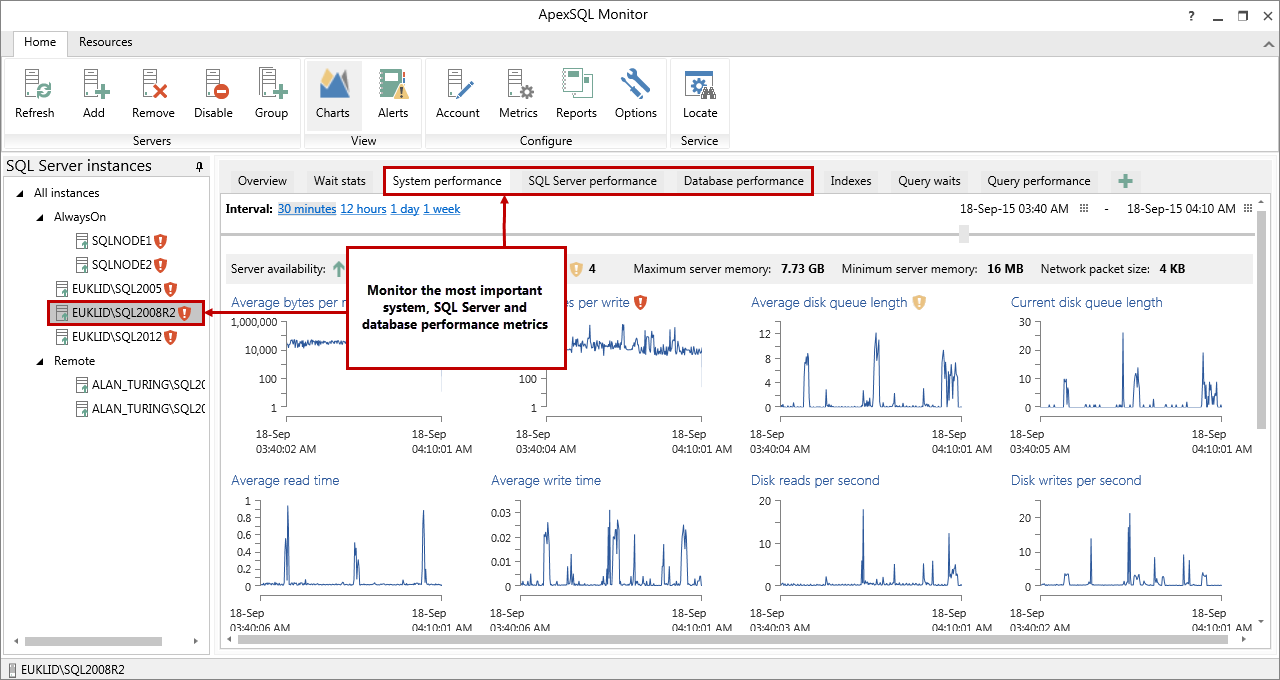
ApexSQL is an another best SQL server monitoring tools. You can monitor, detect, and solve SQL Server performance problems easily with ApexSQL tool.
SQL Server, system and database metrics monitoring: Monitor the most important SQL Server, system and database performance parameters such as longest running transactions, page life expectancy, buffer cache hit ratio, processor utilization, available memory, database size, log growth and much more. See about prices of ApexSQL tool here.
8. AppDynamics
AppDynamic is a SQL Server performance monitoring software. The AppDynamics Database Monitoring product module for Microsoft SQL Server is a comprehensive 24×7 deep-dive tool used to monitor versions 2000, 2005, 2008, 2012 and 2014 of SQL Server instances running on any platform.
It offers a mature feature set that includes such attributes as buffer management; pessimistic and optimistic concurrency control; an ETL (Extract-Transfer-Load) tool, OLAP (Online Analytical Processing) capabilities; messaging and alert technologies; Database Mirroring using Windows Clustering for High Availability; Remote Replication using AlwaysOn for disaster recovery; and in-memory column store. SQL Server 2014 will include in-memory transaction processing technology, in addition to other new features.
9. Zenoss
Zenoss is a monitoring program with an open source license that belongs to Zenoss Inc. commercial support. This program can be downloaded for free and can be run on the platform Multi Distro Linux OS and distributed under the GNU Public License. Zenos application can be used to observe the computer device, Network Device (Switch, Router etc.) that are currently active from the interface, processes, services, file system, and routing. All computers on the network can be monitored simultaneously both run on Windows and Linux platforms. All Activities devices can be displayed as text or in graphic form; Alert Messages can be sent via email or SMS.
10. Nagios
Nagios can also be the best choice if you want to find it easy to monitor your SQL server. Through Nagios, you can monitor the entire activity of the infrastructure and every server service you use. Nagios also is known to be a complete monitoring program that is used by many developers in which it makes Nagios become one of the best monitoring applications today. If you are confused which software that you have to choose, then you are recommended to choose Nagios as one of the most popular SQL server monitoring software nowadays.
11. Zabbix
Zabbix is one of the free monitoring apps that are used to monitor the network and status of various network services, SQL servers, and other network hardware. Created by Alexei Vladishev, this software supports polling and trapping. The advantage offered by Zabbix is that this software is open source software that can be easily downloaded and free of charge. Also, Zabbix also has a nice GUI, so it is easily understood by users (providing visualization such as maps and charts that also help us in administrative arrangements and systems).
12. OP5 Monitoring
There are so many monitoring software options that offer complete monitoring service including physical and virtual. One of the best options to get this comprehensive monitoring is OP5 that offers to monitor for all types of the server including physical and virtual. Therefore, this can be a good choice to monitor your SQL server as the most flexible option. Besides, the OP5 can also handle a device with big volume. The key metric provides a dashboard for showing uptime server performance and health, the use statistic, and identification.
13. Monitis
Monitis can be the best option to monitor your SQL server because this monitoring tool offers all-in-one monitoring for server tracking, website tracking, and app tracking wherever and whenever you want without limiting time. In this case, you can measure the page load, uptime, stress testing, and transaction. Since this software is also cloud-based monitoring software, then you do not need to install any programs because it can run in a few minutes.
14. Happy Apps
The HappyApps monitoring software provides a sophisticated uptime monitoring from both apps and IT system and offers SSH as well as cloud-based connectivity agent. This can be your best option if you want to use a program to monitor your SQL server because it is able to show overall status and map the server system. Happy Apps also becomes one of the most favorite monitoring programs that is used by many developers.
15. Anturis
Another option if you want to use a monitoring tool that offers complete service is Anturis. Anturis offers a full package to monitor service, server, SQL server, software, network, website, and much more. All of those services are included in the provided dashboard. This software is cloud-based software, so you do not need to install some additional programs, allocate hardware and resources.
16. Munin
Munin also becomes an option for better monitoring software. It is almost similar to Cacti, where Munin is also using RRDTool to present the output in a pretty good chart over the web. Munin main emphasis is on the “plug and play” as the interactive plugins. There are also so many plugins that you can choose. Munin also becomes one of the monitoring programs that is in desired by web developers because it offers convenience to monitor the SQL server and offers a lot of features so that users can easily monitor their servers and real-time.
17. Lepide: SQL Server Storage Manager
The Lepide SQL Server storage manager is a free utility to analyze performance and structure of your SQL Servers, providing complete visibility of storage space and performance. It enables IT, teams, to identify potential issues before they occur quickly.
Key features
- Removes the need to writing complex SQL Servers and stored procedures
- Provides real-time alerts based on easy to configure criteria
- Provides a centralized platform to create consolidated reports of all SQL resources
- Provides simple graphical displays showing all elements of your SQL servers
Key benefits
- Effectively track, manage and plan disk space utilization across your SQL servers
- Identify issues with defragmentation, table partitioning, object switching and indexes
- Reduce network traffic time by partitioning databases, heaps, and indexes
- Better visibility of databases, file groups, files, and tables and more.
18. Cacti
Cacti is one of the monitoring tools that is widely used for monitoring purposes today. Cacti stores all data and information required to create graphics and collect the MySQL database. To run Cacti, it requires supporting software such as MySQL, PHP, RRDTool, net-SNMP, and a web server that supports PHP as Apache or IIS. Cacti is one open source application solutions for the network graphing tools that are designed to harness the power of RRDTool functions as data storage and graphing. Cacti provide a fast data collection, advanced chart patterns, multiple data acquisition methods, and user management features.
19. Performance Co-Pilot
One of the another sophisticated monitor tools is Performance Co-Pilot that can help the system performance as well as framework analysis to gather some metric data from the various operating system using historical data or in real-time. This software supports all of the operating system options such as Linux, Windows, and Mac Os. Here, you can monitor your SQL server conveniently with the help of Performance Metric Domain Agen to collect domain and performance measurement.
Conclusion
In the software industry, you may know more and best SQL Server monitoring tools that we do not add them to this list. If you are already working with other SQL server performance monitoring tools, please let us know through comment section. And we welcome your idea about these best SQL Server monitoring tools as well.
Nice article! Another great tool for server monitoring, not listed here is Monitis (www.monitis.com). Among its key features are native agents for Windows and Linux, down to 1 min checks, CPU, Memory, Storage and Disk, Network Bandwidth etc.
It may not be one of the top 20 apps for monitoring SQL Server, but my favorite is SQL Gumbo! I am using the Gumbo Recipes feature for building my own app.
App is still in beta at this time. Could be potential with this one. We’ll see.
Evaluate SQLTop* for SQL Server, free and cheap tool, portable.
http://www.sqltop.com
A new comer to the SQL server monitoring family is Detecta, a cloud based solution that provides deep dive capability into your SQL instance, Server info and the ability to create custom alerts based on over 100 configurable counters.
Check Syskit.com tools for SQL server monitoring and administration. Free trials are available as well.
I ‘d mention that most of us visitors are endowed to exist in a fabulous place with very many wonderful individuals with very helpful things
AKAWN Monitoring is new and allows for free SQL Server monitoring
I’d mention miniDBA – it offers higher resolution monitoring than most other tools at a much lower level of details. It stores monitored t-sql execution plans in it’s data store for tuning as well as healthchecks for server and database level issues, wait type monitoring plus email & slack alerts. It offers a free version plus a less heavyweight web ui alternative.
Quest – Foglight has been monitoring up to 149 of our SQL Server instances for over 4 years. I’m curious to know why this didn’t make this list unless it was the #1 tool to use. This article starts at #2 — SpiceWorks.
There is one more awesome tool – SQL Planner – that has a great feature
can you write about it also in the list? Th